Reducing Sidekiq Memory Usage With Jemalloc
Ruby and Rails don’t have a reputation of being memory-friendly. This comes with a trade-off of being a higher level language that tends to be more developer-friendly. For me, it works. I’m content knowing I might have to pay more to scale a large application knowing I can write it in a language I enjoy.
Turns out…Ruby’s not the memory hog I’d previously thought. After some research and experimentation, I’ve found jemalloc to offer significant memory savings while at least preserving performance, if not improving it as well.
The Problem
At Bark, we poll external APIs for millions of monitored social media, text, and emails. This is all done through Sidekiq background jobs. Even though Ruby doesn’t truly allow parallelism, we see great benefit with Sidekiq concurrency as the jobs wait for external APIs to respond. The API responses can often be large, not to mention any media they might include. As a result, we see the memory usage of our Sidekiq workers increase until they’re ultimately killed and restarted by systemd.
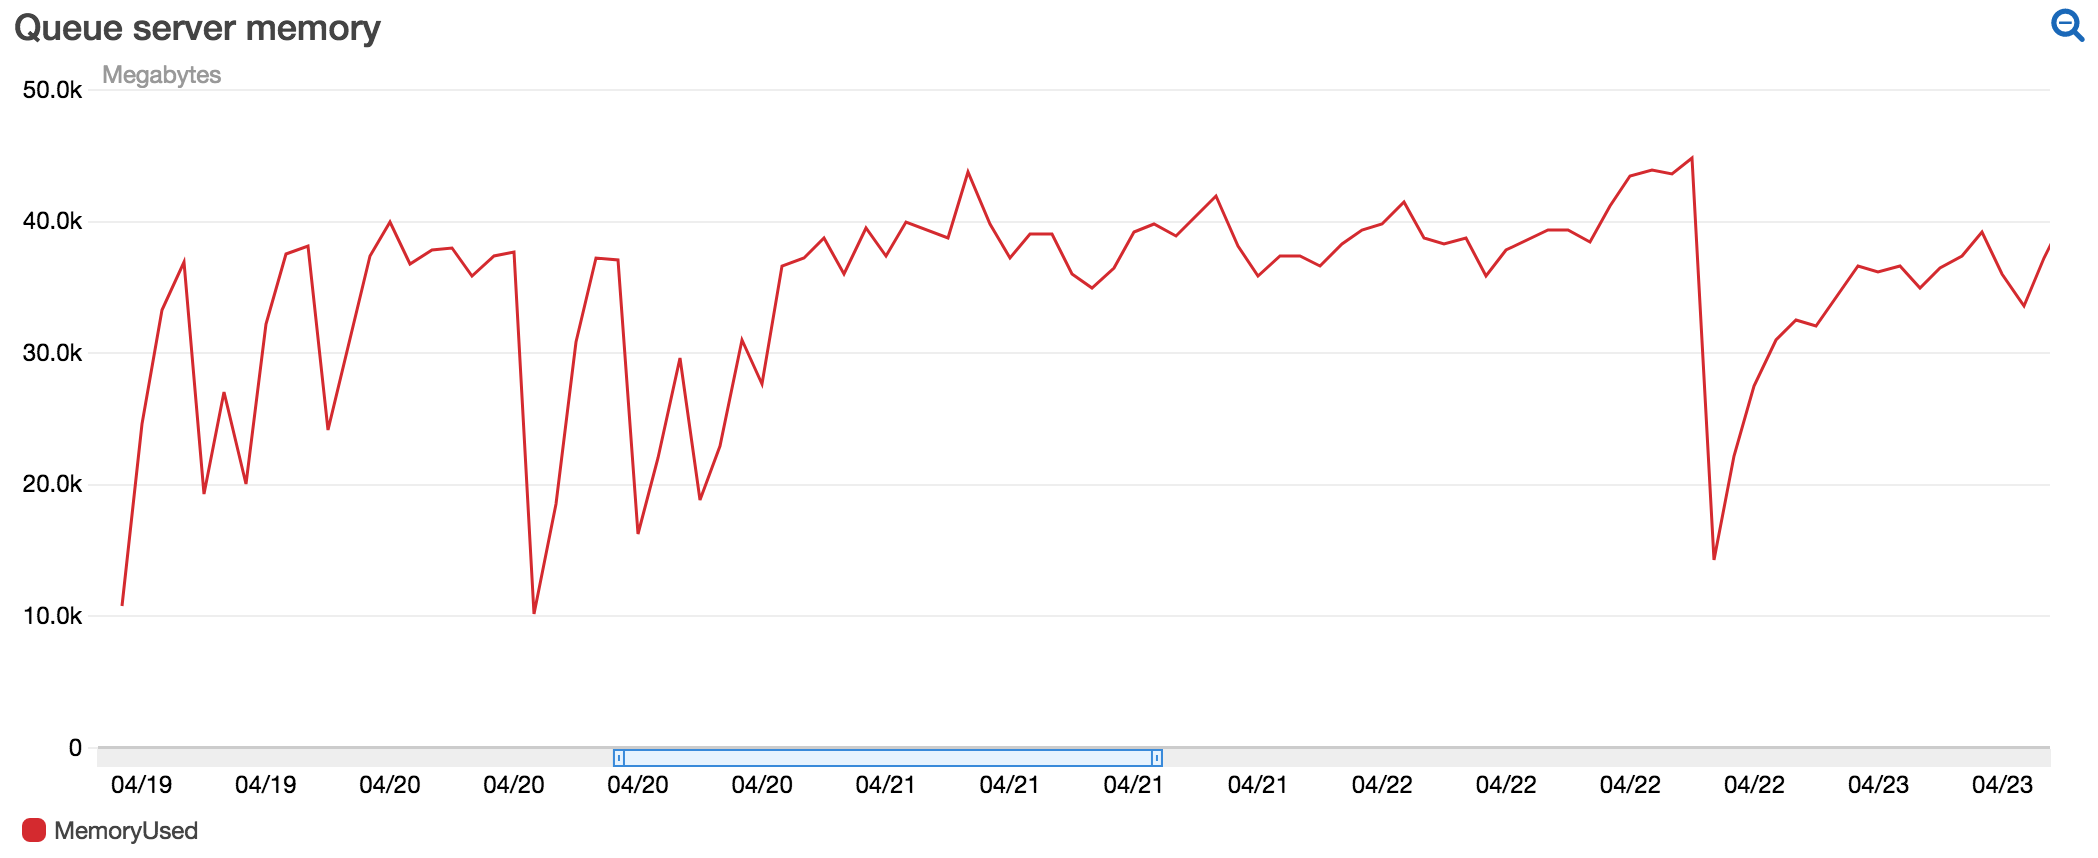
The following shows a common memory usage pattern for our queue servers:

Two things to notice:
Memory increased quickly - The rise of memory happens immediately after the processes are restarted. We deploy multiple times a day, but this was especially problematic on the weekends when deploys are happening less frequently
Memory wasn’t reused until restarted - The jaggedness of graph towards the center is the result of the memory limits we imposed on the
systemdprocesses, causing them to be killed and ultimately restarted until they later reach the configured max memory setting again. Because the processes didn’t appear to be reusing memory, we saw this happen just a few minutes after being restarted.
The Solution
As the author of a multi-threaded background processing library, I frequently see reports of memory leaks in Rails applications. As a Sidekiq user, this one caught my attention. It starts as a classic memory leak report, but later turns towards deeper issues in the underlying operating system, not in the application. With Nate Berkopec’s post on Ruby memory usage in multi-threaded applications referenced, the reporter found switching to jemalloc to fix their issue.
jemalloc describes itself as:
a general purpose malloc(3) implementation that emphasizes fragmentation avoidance and scalable concurrency support
The description targets our use-case and issues with the current memory allocator. We were seeing terrible fragmentation when using Sidekiq (concurrent workers).
How to use jemalloc
Ruby can use jemalloc a few different ways. It can be compiled with jemalloc, but we already had Ruby installed and were interested in trying it with the least amount of infrastructure changes.
It turns out Ruby will attempt to use jemalloc if the well-document environment variable LD_PRELOAD is set.
Our Sidekiq servers use Ubuntu 16.04, so we started by installing jemalloc:
sudo apt-get install libjemalloc-devFrom there, we configured the LD_PRELOAD environment variable by adding the following to /etc/environment:
LD_PRELOAD=/usr/lib/x86_64-linux-gnu/libjemalloc.so.1Note: The location of jemalloc may vary depending on version and/or Linux distribution.
Benchmark
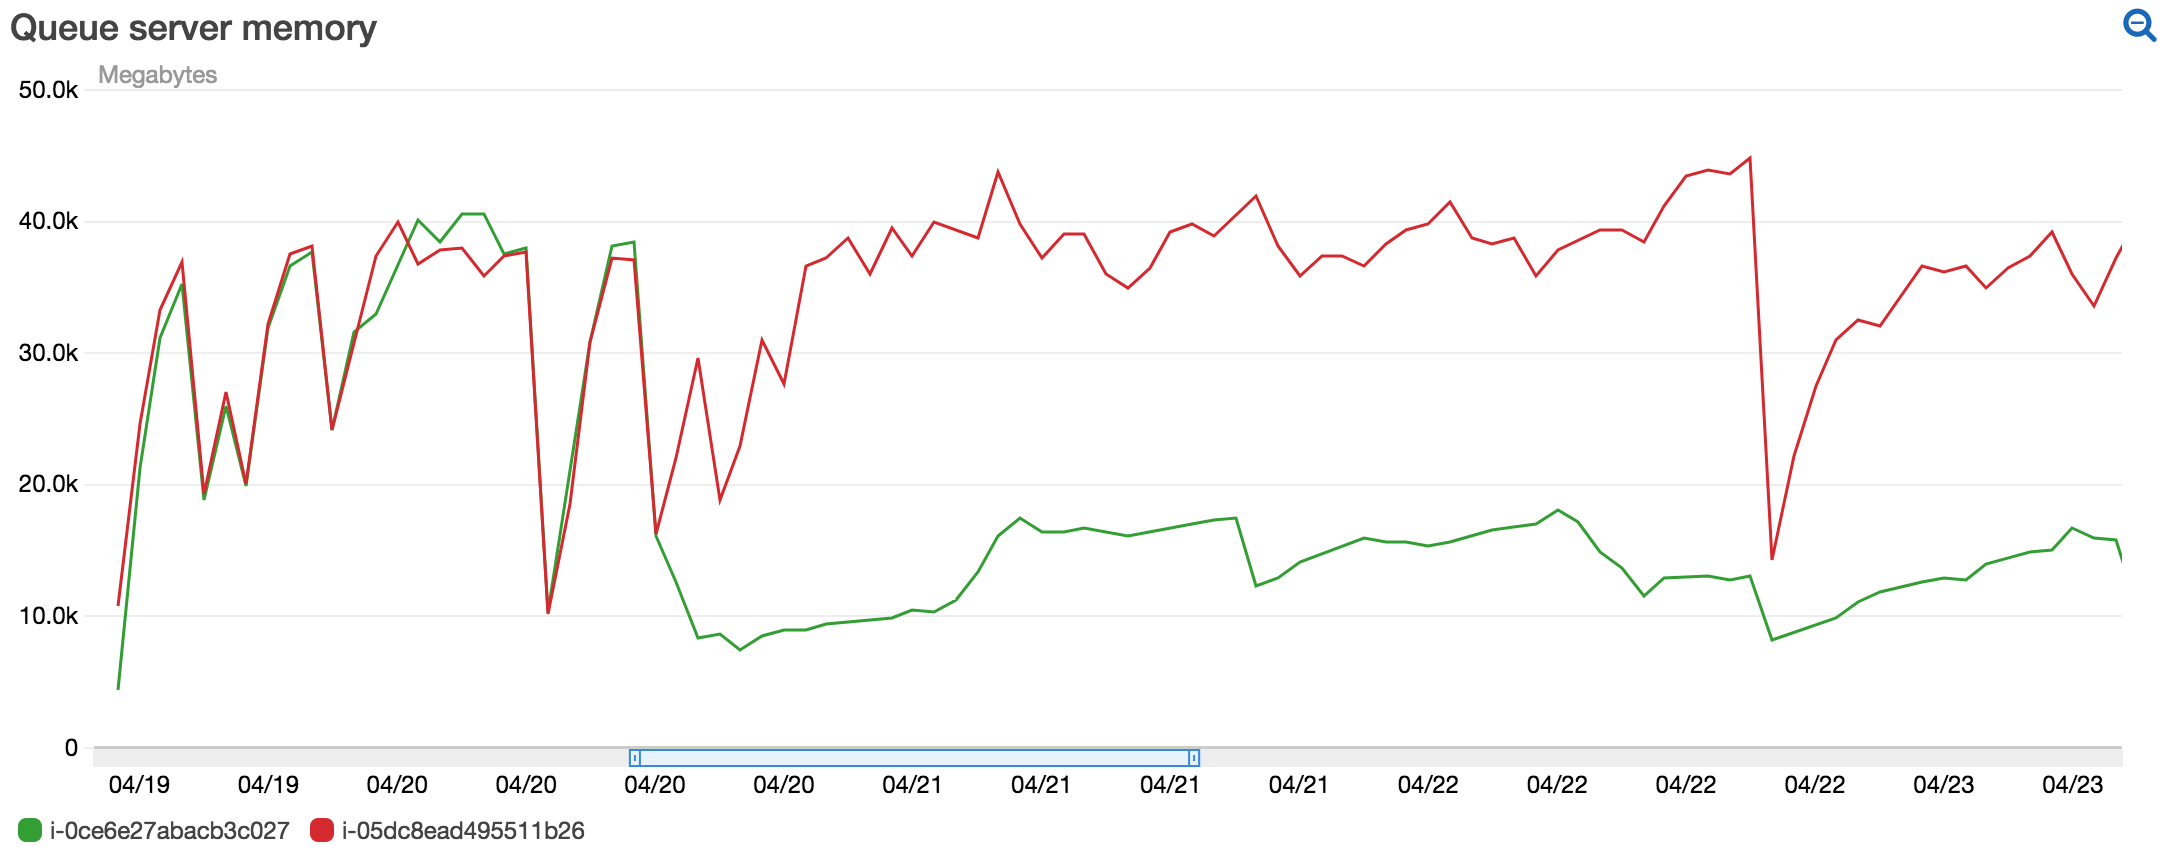
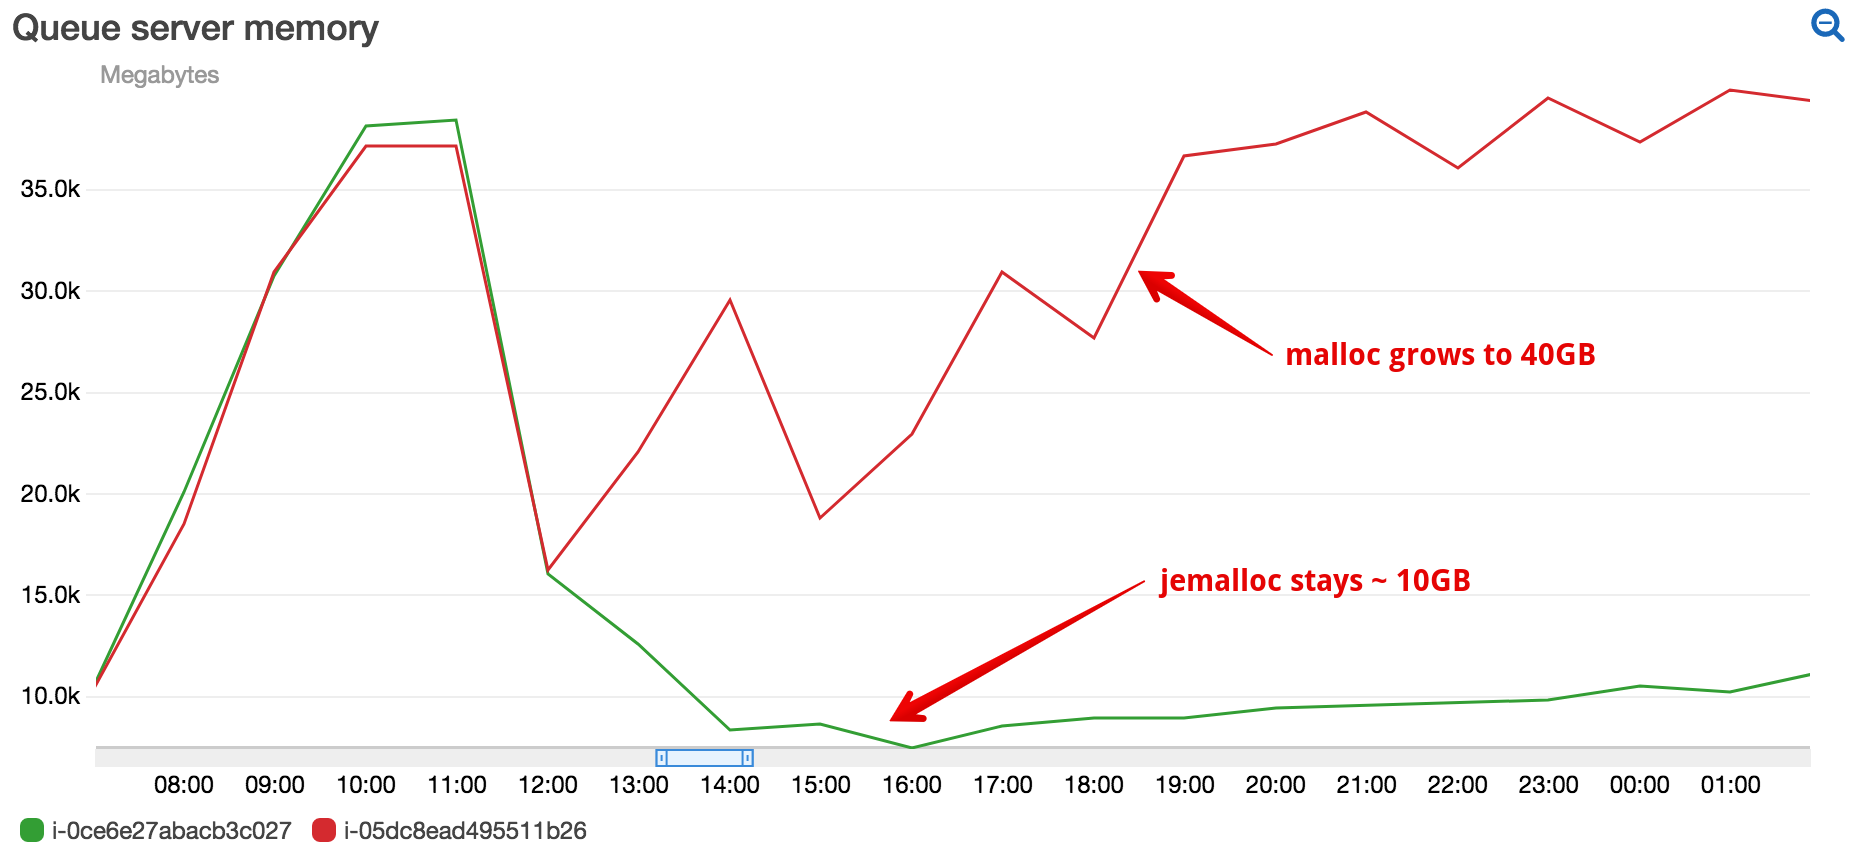
We benchmarked jemalloc on just one of the queue servers. This would allow us to do a true comparison against similar activity.

As we can see, the difference is drastic – over 4x decrease in memory usage!
The more impressive detail was the consistency. Total memory usage doesn’t waver much. Processing large payloads and media, I assumed we’d continue to see the peaks and valleys common to processing social media content. The sidekiq processes using jemalloc show a better ability to use previously allocated memory.

Roll it in to production
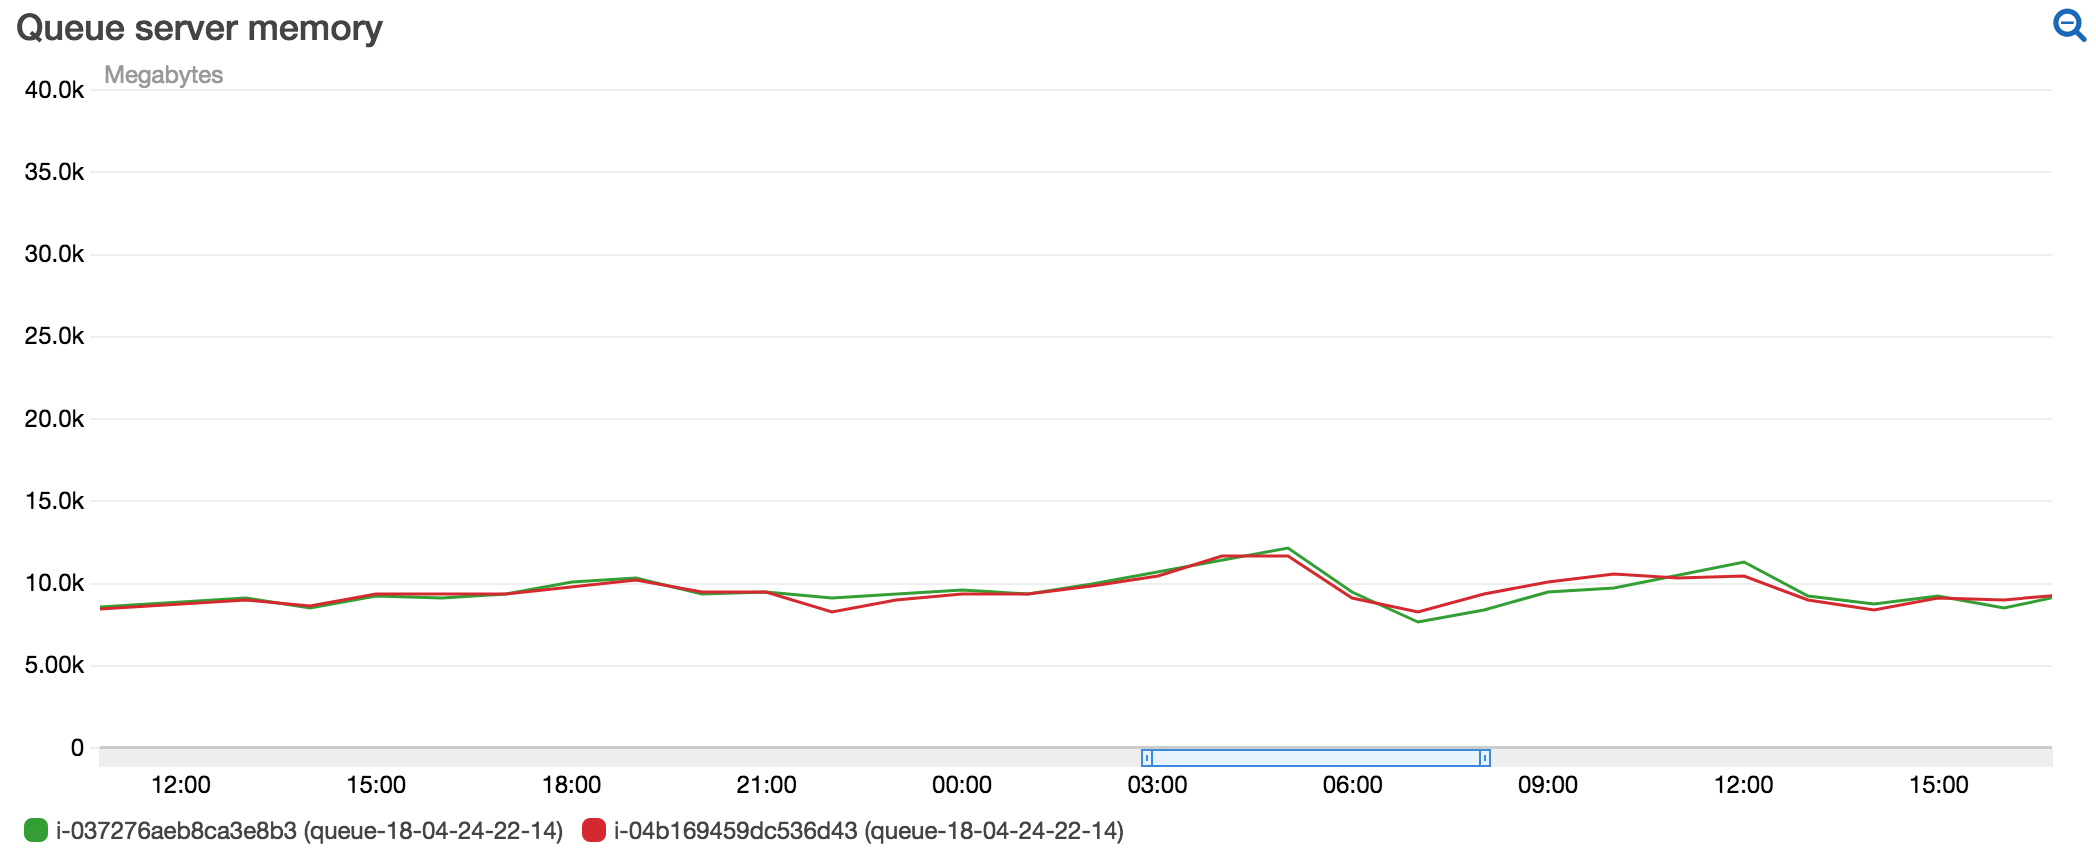
With similar behavior over a 3 day period, we concluded to roll it out to the remaining queue servers.
The reduced memory usage continues to be impressive, all without any noticeable negative trade-offs.

Conclusion
We were surprised by the significant decrease in memory usage by switching to jemalloc. Based on the other reports, we assumed it be reasonable, but not a 4x decrease.
Even after looking at these graphs for the last couple days, the differences seem too good to be true. But all is well and it’s hard to imagine NOT doing this for any Ruby server we deploy in the future.
Give it a shot. I’d love to see your results.
