Monitoring Sidekiq Using AWS Lambda and CloudWatch
A few articles ago, I wrote about how to monitor Sidekiq retries using AWS Lambda. Retries are often the first indication of an issue if your application does a lot of background work.
As Bark continues to grow, we became interested in how the number of jobs enqueued and retrying trended over time. Using AWS Lambda to post this data to CloudWatch, we were able to visualize this data over time.
The Problem
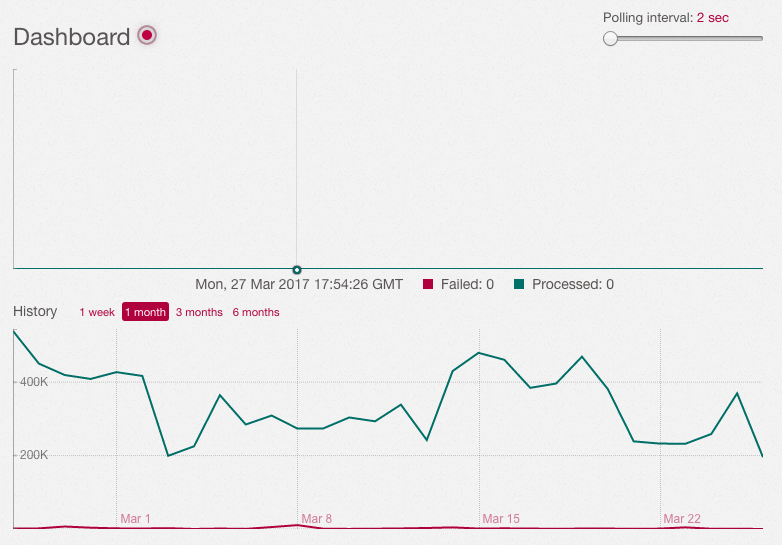
Sidekiq offers a way to visual the jobs processed over time when on the dashboard. In fact, this graph was one of my first open source contributions.

Unfortunately, these graph don’t show the number of retries from 2 am last night, or how long it took to exhaust the queues when 2 million jobs were created.
Historical queue data is important if our application does a lot of background work and number of users is growing. Seeing these performance characteristics over time can help us be more prepared to add more background workers or scale our infrastructure in a way to stay ahead when our application is growing quickly.
The Solution
Because Bark is on AWS, we naturally looked to their tools for assistance. We already use CloudWatch to store data about memory, disk, and CPU usage for each server. This has served us well and allows us to set alarms for certain thresholds and graph this data over time:

Knowing we’d have similar data for queue usage, we figured we could do the same with Sidekiq.
Sidekiq Queue Data Endpoint
If you remember from the last article on monitoring Sidekiq retries using AWS Lambda, we setup an endpoint in our application to return Sidekiq stats:
require 'sidekiq/api'

class SidekiqQueuesController < ApplicationController
  skip_before_action :require_authentication

  def index
    base_stats = Sidekiq::Stats.new
    stats = {
       enqueued: base_stats.enqueued,
       queues: base_stats.queues,
       busy: Sidekiq::Workers.new.size,
       retries: base_stats.retry_size
    }

    render json: stats
  end
end
along with the route:
resources :sidekiq_queues, only: [:index]Using this resource, we need to poll at some regular interval and store the results.
AWS Lambda Function
AWS Lambda functions are perfect for one-off functions that feel like a burden to maintain in our application.
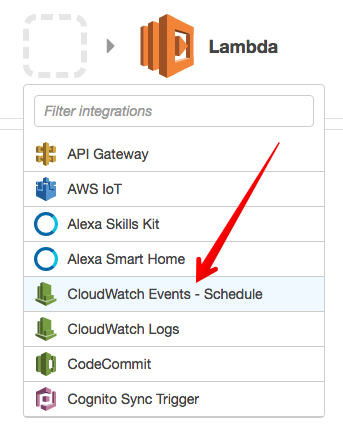
For the trigger, we’ll use “CloudWatch Events - Schedule”:

From here, we’ll enter a name and description for our rule and define its rate (I chose every 5 minutes). Enable the trigger and we’ll move to defining our code. Next, we’ll give the function a name and choose the latest NodeJS as the runtime. Within the inline editor, we’ll use the following code:
var AWS = require('aws-sdk');
var url = require('url');
var https = require('https');

if (typeof Promise === 'undefined') {
  AWS.config.setPromisesDependency(require('bluebird'));
}

var cloudwatch = new AWS.CloudWatch();

sidekiqUrl = '[Sidekiq stat URL]'

var logMetric = function(attr, value) {
    var params = {
        MetricData: [
            {
                MetricName: attr,
                Dimensions: [
                    {
                        Name: "App",
                        Value: "www"
                    }
                ],
                Timestamp: new Date(),
                Unit: "Count",
                Value: value
            }
        ],
        Namespace: "Queues"
    };

    return cloudwatch.putMetricData(params).promise();
}

var getQueueStats = function(statsUrl) {
    return new Promise(function(resolve, reject) {
        var options = url.parse(statsUrl);
        options.headers = {
            'Accept': 'application/json',
        };
        var req = https.request(options, function(res){
            var body = '';

            res.setEncoding('utf8');

            //another chunk of data has been recieved, so append it to `str`
            res.on('data', function (chunk) {
                body += chunk;
            });

            //the whole response has been recieved
            res.on('end', function () {
                resolve(JSON.parse(body));
            });
        });

        req.on('error', function(e) {
           reject(e);
        });

        req.end();
    });
}

exports.handler = function(event, context) {
    getQueueStats(sidekiqUrl).then(function(stats) {
        console.log('STATS: ', stats);

        var retryPromise = logMetric("Retries", stats.retries);
        var busyPromise = logMetric("Busy", stats.busy);
        var enqueuedPromise = logMetric("Enqueued", stats.enqueued);

        Promise.all([retryPromise, busyPromise, enqueuedPromise]).then(function(values) {
            console.log(values);
            context.succeed();
        }).catch(function(err){
            console.error(err);
            context.fail("Server error when processing message: " + err );
        });
    })
    .catch(function(err) {
        console.error(err);
        context.fail("Failed to get stats from HTTP request: " + err );
    });
};
Note: sidekiqURL need to be defined with appropriate values for this to work.
Within CloudWatch, we’re defining a new namespace (“Queues”) where our data will live. Within this namespace, we’ll segregate these stats by the Dimension App. As we can see, we chose www for this value. If we wanted to monitor the queues of a few servers, each one could use a unique App name.
Review and save the Lambda function and we’re all set!
Graphing Sidekiq Queue Data
Once the function has run a few times, under CloudWatch –> Metrics, we’ll see the following custom namespace:

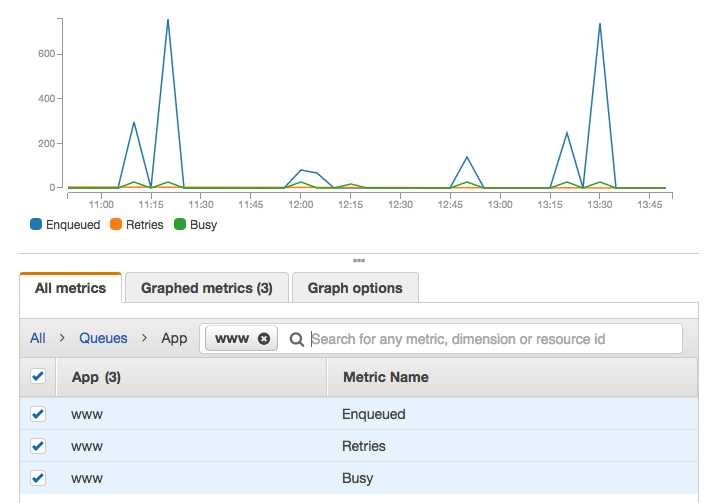
From here, we’ll choose the name of our app (www) and graph the values of each of these values over whatever timespan we want:

Conclusion
I’ve found AWS lamba to be a great place for endpoints/functionality that feels cumbersome to include in my applications. Bringing deeper visibility to our Sidekiq queues has given us the ability to see usage trends we weren’t aware of throughout the day. This will help us preemptively add infrastructure resources to keep up with our growth.
